
Cookie interactions reportUpdated a month ago
View cookie interaction trends
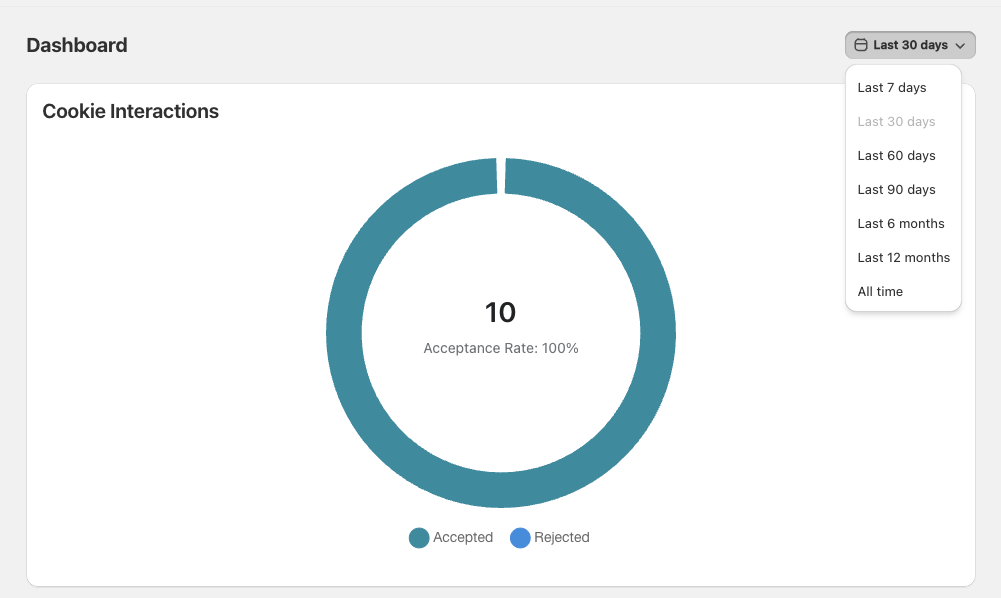
Cookease includes a Cookie Interactions widget on the Dashboard that shows how many visitors accepted or rejected your cookie banner during a selected period.
Use this report when you want a quick view of consent activity over time, including total Accepted and Rejected interactions.
What the widget shows
The Cookie Interactions widget summarizes customer responses to your banner for the selected time range.
Accepted: the number of visitors who accepted cookies
Rejected: the number of visitors who rejected cookies
Acceptance Rate: the share of interactions that were accepted during that period
INFO
The totals in this widget update based on the date range selected from the dropdown in the top-right corner of the Dashboard.
Change the reporting period
1. Open the dashboard - In Cookease, go to the Dashboard.
2. Find the date range dropdown - At the top right, open the dropdown that shows the current range, such as Last 30 days.
3. Choose a time period - Select the period you want to review. Available options include Last 7 days, Last 30 days, Last 60 days, Last 90 days, Last 6 months, Last 12 months, and All time.
4. Review accepted and rejected totals - After you select a range, the Cookie Interactions widget updates to reflect the number of Accepted and Rejected interactions in that timeframe.
When to use each time range
Last 7 days: check recent changes after updating your banner or consent settings
Last 30 days: review a standard monthly snapshot of consent activity
Last 60 days or Last 90 days: compare broader trends and smooth out short-term fluctuations
Last 6 months or Last 12 months: monitor long-term changes in how visitors respond
All time: see the full history of tracked cookie interactions
TIP
If you recently changed your banner design or settings, compare Last 7 days with Last 30 days to see whether acceptance and rejection behavior has shifted.
How to interpret the report
A higher Accepted total means more visitors agreed to cookies during the selected period. A higher Rejected total means more visitors declined.
The widget is useful for spotting changes in customer behavior over time. For example, if rejections increase after a banner update, you may want to review the wording, layout, or options shown to visitors.
Related banner settings
Customer responses in the report are influenced by the choices available on your cookie banner, such as Accept, Manage preferences, and optionally Decline.